Abstract

The fintech ecosystem is a highly dynamic environment. Venture investment in fintech grew by 11% to $17.4 billion in 2016 according to Forbes and Pitchbook . Having a clear picture of this ecosystem at a given point in time is much needed to inform policy activities as evidenced by the European Commission call for tenders SMART 2016/0042. This paper describes our approach to integrating, enriching and presenting data about the fintech ecosystem. It presents FintechBrowser , a demonstrator of an integrated set of dashboards and a graph explorative-browsing tool.

Introduction

Over the past decade we have witnessed technology-driven innovations that disrupted the financial services industry and continue to do so. In consumer payments, nascent start-ups are able to bring to market affordable and flexible cross-border payment solutions outperforming some of the largest traditional financial institutions. In the funding space, the rise of crowd-funding democratised access-to-capital creating a whole new market segment. In investment management, robo-advisors renewed the faith of many in the applications of Artificial Agents while providing satisfying results at competitive costs. Disruption caught-up even with currencies - one of the oldest concepts in the financial industry - with the proliferation of crypto-currencies using blockchain technologies.

Having a clear picture of this ecosystem at a given point in time is much needed to inform policy activities as evidenced by the European Commission call for tenders SMART 2016/0042. Our research is focussed on exploring the fintech ecosystem using ontological modelling. It seeks, inter alia, to improve our understanding of this ecosystem, which is a critically important environment from which solutions to operational risks at financial institutions frequently arise. We combine novel knowledge representation and data modelling techniques to reveal links between concepts represented in the data which otherwise are not accessible. We use semantic web standards to free data from tables & spreadsheets and to enrich it with linked open data. We visualise data through the lens of our ontology and present it on a map and in a navigable graph.

The rest of the paper is structured as follows. In Section 2 we describe our approach to building a fintech knowledge graph 1 . In Section 3 we present FintechBrowser 2 , a tool for presenting and navigating the fintech knowledge graph. Finally, in Section 4 we conclude the paper and outline on-going work to extend the knowledge graph and FintechBrowser.

Towards a fintech knowledge graph

Current semantic web specifications [6] [14] [11] and tools [15] [13] [1] allow to represent a domain by documenting its concepts and the relationships between them, to source data instantiating this representation from heterogeneous sources and to perform automated reasoning to draw inferences and deductions from data following the domain representation. We build on these capabilities in order to construct the nucleus of a knowledge graph of the fintech ecosystem. Ehrlinger & Wöß [7] outline that a knowledge graph is somehow superior to a knowledge base as a knowledge graph acquires and integrates information into an ontology and applies a reasoner to derive new knowledge 
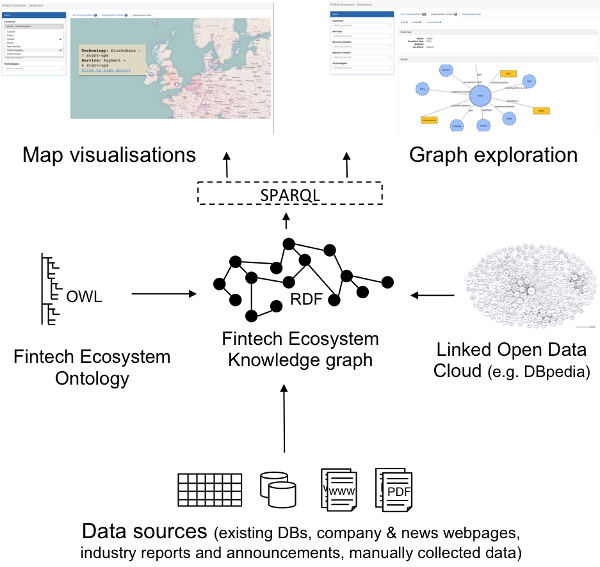
. At the heart of this fintech knowledge graph is our OWL fintech ontology. We enrich the latter with custom-built layers of extensions to include additional domain knowledge and by tapping into, and reusing knowledge from, the Linked Open Data Cloud. Section 4 outlines our plan to evolve this knowledge base into a knowledge graph.

Building an ontology of the fintech ecosystem

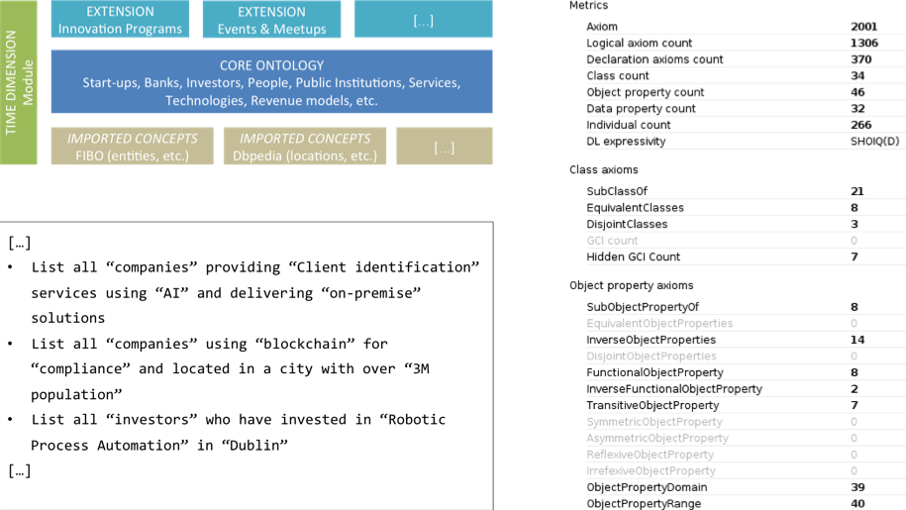
We follow a Design Science approach in building our ontology [12] . With the objective of maximising our ontology's chances of reuse, we pay special attention to guidelines 2 and 4 on the relevance of the research and the value of the contribution as described by Hevner et al. To this end, we have assembled an advisory committee of domain experts in financial services, in fintech and in technology [10] to observe, assist and assess. The ontology architecture is described in Figure 1 (Top left). A core module contains definitions of OWL classes, object properties and restrictions representing the main actors of the fintech ecosystem and the relationships among them. Extension modules build on top of the core one to add further concepts as we learn about them or as they become relevant to the applications/queries this ontology underpins. For example, we are designing an extension to represent innovation programs and accelerators and another extension to represent conferences and industry events. In addition to these two layers and as our study evolves, the time dimension is becoming more and more relevant to support for example queries about people changing roles or investment trends over time. To this end, we are adding time-related information to some concepts, roles and relationships. The ontology metrics of the current version of our core ontology module are highlighted in Figure 1 (Right) in a screenshot from Protégé [15] .

Ontology's architecure

Figure 1. (Top left) Overview of the fintech ecosystem ontology and its extensions. (Bottom left) Excerpt of the ontology key competency questions. (Right) Excerpt of the Core ontology metrics from Protégé.

Validating and enriching the ontology

In our Design Science approach and following guidelines 3 and 5 on evaluation and rigour [12] , we gathered a set of queries that the first version of the ontology should help answer. This is in-line with ontology engineering best practices and widely referenced guidelines [16] [8] . Figure 1 (Bottom left) shows an excerpt of these questions. As we were capturing these key competency questions, we were able to identify classes and entities which are highlighted between quotes in Figure 1 (Bottom left) and which made their way to our ontology.

The Linked Open Data community is growing steadily [3] [5] and in particular Dbpedia [2] contains knowledge relevant to this study. We link to Dbpedia to obtain information, for example, about locations, cities and population sizes. We use this linked data in queries such as the second one described in Figure 1 (Bottom left), where we correlate technologies with services and locations of firms and then filter by the size of the population in this (these) location(s). Another source of knowledge we are currently working on linking to, is the Financial Industry Business Ontology (FIBO). FIBO is an initiative supported by many institutions [4] . Modules of FIBO are undergoing the Objet Management Group's rigorous standardisation process [9] . In particular, FIBO Business Entities and its modules contain knowledge relevant to this study such as the definitions of entities and corporations and also individuals representing a wide array of regulators in different jurisdictions.

FintechBrowser to navigate the graph

The architecture of FintechBrowser is illustrated in Figure 2 . A front-end sits on top of the knowledge graph. It allows the user to express queries by selecting filtering criteria and constraining them. FintechBrowser then translates these user queries into SPARQL queries that are executed against the graph. FintechBrowser allows the user to visualise and navigate the knowledge graph. It has three main front-end views: 1) a list view, 2) a map view, and 3) a graph view. All three views are controlled by the aforementioned set of selection criteria and filters.

FintechBrowser's software architecure

Figure 2. Software architecture of FintechBrowser.

For experimentation purposes, we loaded a test dataset containing information about 200+ fintech firms, banks and investors located in Europe, the United States and Africa. In the map view, we were able to see the how the firms where geographically clustered and distributed with just a glance at the screen. This was facilitated by SPARQL queries launched at runtime to Dbpedia in order to retrieve geographic coordinates of firms' locations. In the graph navigation view, we were able to explore for each node in the graph all the nodes linked to it. See for example screenshot in Figure 3 where the user started from a firm providing a compliance analysis service, navigated to another one using the same technology: blockchain, to see that the second firm uses the same technology but for a different service, namely payment.

FintechBrowser's main interface

Figure 3. Screenshot of FintechBrowser in the graph navigation view.

One major advantage of this approach is that some of these links were not asserted in the original dataset but rather inferred at runtime using the domain description in the ontology. For instance, in response to the query: list all investors who have invested in (a company that is located in) Dublin , the system was able to follow the property chain: (investor) investedInRound (investmentRound) + (company) hasReceivedInvestmentInRound (investmentRound) + (company) isLocatedIn (city) in order to infer (investor) investedInCity (city) . Furthermore, the location attribute in the ontology, combined with instance data from Dbpedia allowed the system to automatically answer queries such as the second one described in Figure 1 (Bottom left).

Conclusions

In this paper we described on-going research aiming at improving our understanding of the fintech ecosystem. We followed a semantic web approach in so far we used semantic web de facto standards to guide and express our knowledge representation of this domain. In building the ontology, we followed design science research guidelines on rigour and relevance. We sought advice and feedback from a committee of international domain experts. We also built FintechBrowser a demonstrator of an integrated set of dashboards and graph navigation tool. FintechBrowser reuses the ontology enriched with linked open data and populated with a test dataset to highlight the benefits of this approach and how it contributes to increasing our understanding of the fintech ecosystem. We conducted a set of experiments with FintechBrowser and experienced first hand the advantages of discovering associations in the knowledge base by visually navigating from node to node without the need for typical tabular data manipulation such as pivot and manual cross-referencing. FintechBrowser along with the fintech ecosystem ontology also allowed us to demonstrate one major benefit of this approach namely: you do not need to have all the data about the ecosystem, the system will create associations between entities using the domain knowledge represented in the ontology.

As it stands, FintechBrowser operates on manually collected data, which we believe is an impediment to it reaching its full potential and helping us improve our understanding of the fintech ecosystem. We are exploring a series of algorithms to automatically (or semi-automatically) collect instance data and evolve our knowledge base to a knowledge graph [7] . We are evaluating Named Entity Recognition and other Natural Language Processing techniques to populate the graph from different sources including company websites and news. With more data continuously being added and time-stamped, it is our expectation that through this study we will be able to deepen our understanding of this ecosystem by exploring the impact of criteria such as "education", "tax rates", etc. on fintech performance expressed in terms of number of "deal values", "patents", etc. at a given "location", and in a subsequent step to explore scenarios of future development of the fintech ecosystem.

Acknowledgments

This work is supported by Enterprise Ireland and IDA Ireland under the Government of Ireland Technology Centre Programme. It is also supported by University College Dublin, College of Business Research Support scheme 2017.

References

Footnotes

The ontology will be made available at: https://github.com/FinTechEcosystem . [back]

Demonstrations of FintechBrowser are available via: http://fintechecosystem.net . [back]